 |
| 50-DAY MOVING AVERAGE AND ITS APPLICATIONS: Tips and Strategies |
Moving averages are among the most widely used technical indicators in trading and investing. They've also been used to create other trading indicators such as Bollinger Bands and the MACD.
Because they are such a versatile tool, they can be used in a variety of settings and combined with other indicators.
Even with itself, but with a different length, as we will see later in our strategic analysis.
What are moving averages?
This article will explain what the 50-day moving average is, why it is so popular, and how to use it.
A moving average is a technical indicator that attempts to identify the average price of an asset over a given period. Looking at the data from the Covid-19 pandemic is a good way to explain what moving averages are.
Many countries used to include the 7-day moving average in addition to the daily Covid-19 cases. As a result, if the daily case count is 10,000 and the 7-day MA is 4,000, the situation is deteriorating. Similarly, if the daily count is 4,000 and the 7-day average is 15,000, it could indicate that things are looking up.
The same idea holds true in the financial market. If a stock is trading at $10 and the 7-day moving average is at $6, it is becoming overpriced.
Different types of moving averages
As previously stated, moving averages are used to determine the average price of an asset over a given period. While this concept is sound, there are several ways to identify the same figure. The Simple Moving Average (SMA), for example, treats all periods the same.
As a result, if you calculate a 200-day moving average, all periods will be the same. Many experts are perplexed by this situation because the overall weight of the data should be skewed toward recent events.
As a result, several types of moving averages attempt to address this issue:
- Exponential moving average (EMA) - An EMA is a type of MA that places a greater emphasis on recent financial data.
- Least squares moving average (LSMA) - This type of MA computes the least squares regression line for the previous period.
- Smoothed moving average (SMMA) - This is a type of MA that gives more weight to price data that has been collected over a long period.
- Volume-Weighted Moving Average (VWMA) - A type of MA that incorporates the concept of volume into its calculation.
As a result, when applied to a chart, these indicators typically produce disparate results.
 |
| 50-DAY MOVING AVERAGE AND ITS APPLICATIONS: Tips and Strategies |
What is the 50-day moving average?
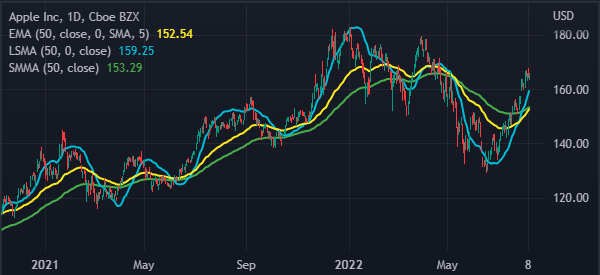
The chart below depicts the various types of 50-day moving averages.
The 50-day moving average is simply an MA that considers the previous 50-day period. In the case of cryptocurrencies, which are traded daily, the 50-day moving average will account for the previous 50 days.
The 50-day moving average, on the other hand, refers to the previous 50 trading days for stocks that are traded five days a week.
In the meantime, on an hourly chart, the 50-period moving average refers to the previous 50 hours, and so on.
50-day simple moving average vs. 50-day exponential moving average
The difference between the 50-day SMA and the 50-day EMA is a frequently asked question. As previously stated, the main distinction is in how the two indicators are calculated. All data points are treated equally by the SMA indicator.
The 50-day EMA, on the other hand, emphasizes the most recent data. To calculate the EMA, first, compute the overall simple moving average. The indicator then introduces the concept of a multiplier and employs the following formula:
(2 / (Time periods + 1)) = (2 / (10 + 1)) = 0.1818 (18.18%)
Finally, using the following formula, the EMA is calculated:
EMA = Close - EMA (previous day) multiplied by multiplier + EMA (previous day).
TRADING STRATEGY FOR A 50-DAY MOVING AVERAGE
When trading with the 50-day moving average, there are several strategies to consider. Let's take a look at some of these trading strategies below.
Following the trend
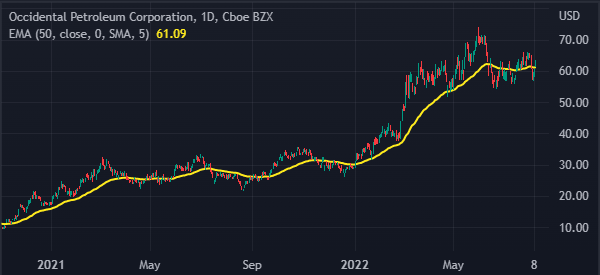
Trend-following is a trading strategy in which a trader buys an asset that is already in a bullish trend or sells an asset that is already falling. The 50-day moving average will be a good exit point in this case.
The assumption is that as long as financial assets such as stocks, forex, and commodities are above the moving average, they will continue to rise.
As a result, when the asset falls below the 50-day moving average, an exit point will be identified. The Occidental shares shown below are a good example of this.
 |
| 50-DAY MOVING AVERAGE AND ITS APPLICATIONS: Tips and Strategies |
The golden cross
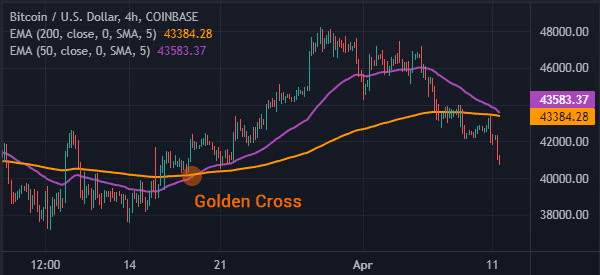
A golden cross is another popular strategy for using the moving average. It is a method of combining the 50-day and 200-day moving averages.
When the two moving averages cross at a lower level, it is usually a sign that the bulls have won and the bullish trend will continue.
 |
| 50-DAY MOVING AVERAGE AND ITS APPLICATIONS: Tips and Strategies |
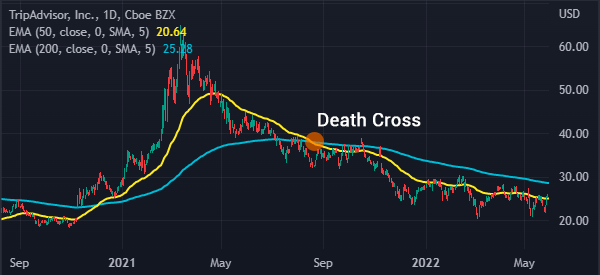
Cross of Death
The death cross is the polar opposite of the golden cross. During a down market, it usually forms when the 50-day and 200-day moving averages cross bearishly. It is one of the most reliable bearish signals for trading.
 |
| 50-DAY MOVING AVERAGE AND ITS APPLICATIONS: Tips and Strategies |
Support and opposition
Another important application of the 50-day moving average is in determining support and resistance levels.
Support is a price that an asset cannot move below, whereas resistance is a price that it cannot move above.
A move above the resistance level usually indicates that the bullish trend will continue, whereas a move below the support level usually indicates that the bearish trend will continue.
SUMMARY
A 50-day moving average is a useful tool in trading and investing. And it is critical to learn how to use it! As we've seen, it applies to a wide range of strategies and timeframes.
When a bullish asset crosses the 50-day moving average, it usually signals that the bearish trend is coming to an end. It can also be used to identify bullish and bearish crossovers, as well as continuations.

